In this beginner's guide, I will walk you through the process of predicting stock prices using machine learning. It's a challenging task that requires careful analysis and understanding of market trends.
By following the basic steps and implementing Python code, we can gain valuable insights into stock price movements.
However, it's important to consider limitations and potential risks in our predictions.
Let's dive in and explore the exciting world of stock price prediction together!
Introduction
In this guide, we'll explore the basics of stock price prediction using machine learning. Predicting stock prices is crucial for investors and traders to make informed decisions and maximize their profits.
Machine learning has shown great potential in analyzing vast amounts of data and identifying patterns that can help predict future stock prices accurately.
By utilizing historical stock price data, financial indicators, and other relevant information, machine learning algorithms can learn from past trends and make predictions about future price movements. These algorithms analyze various factors such as trading volume, market sentiment, company news, and economic indicators to generate predictions.
The objective nature of machine learning ensures that predictions are based on data-driven analysis rather than emotions or biases. This approach helps investors make more rational investment decisions by providing them with valuable insights into the potential direction of a particular stock's price.
Overall, understanding the basics of stock price prediction using machine learning can equip individuals with powerful tools to navigate the complex world of financial markets effectively.
Why Stock Price Prediction is Challenging
Navigating the complexities of anticipating stock price movements can be challenging, especially given the numerous factors that influence them. The volatile nature of stock markets makes it difficult to predict with certainty whether prices will rise or fall.
Global events such as economic crises, political instability, and natural disasters can have a significant impact on stock prices. Additionally, company performance plays a crucial role in determining stock prices. Factors such as revenue growth, profitability, and market share can all influence investor sentiment and consequently affect stock prices.
Trying to analyze all these variables manually is virtually impossible due to the vast amount of data involved. This is where machine learning comes into play – using algorithms and historical data, machine learning models can learn patterns and make predictions based on past trends.
However, accurate predictions are still challenging due to the inherent uncertainties in the market and unexpected events that may occur.
import yfinance as yf
import numpy as np
import pandas as pd
from sklearn.model_selection import train_test_split
from sklearn.ensemble import RandomForestRegressor
from sklearn.metrics import mean_squared_error

# 1. Data Collection
def get_stock_data(ticker, start, end):
    stock_data = yf.download(ticker, start=start, end=end)
    return stock_data

# 2. Preprocessing & 3. Feature Engineering
def preprocess_data(data):
    data['High_Low_Percentage'] = (data['High'] - data['Low']) / data['Close'] * 100.0
    data['Percentage_Change'] = (data['Close'] - data['Open']) / data['Open'] * 100.0
    data = data[['Close', 'High_Low_Percentage', 'Percentage_Change', 'Volume']]
    forecast_out = int(30) # predicting 30 days into future
    data['Prediction'] = data[['Close']].shift(-forecast_out)
    X = np.array(data.drop(['Prediction'], 1))
    X = X[:-forecast_out]
    y = np.array(data['Prediction'])
    y = y[:-forecast_out]
    return X, y

# 4. Model Selection & Training
def train_model(X, y):
    X_train, X_test, y_train, y_test = train_test_split(X, y, test_size=0.2, random_state=42)
    clf = RandomForestRegressor(n_estimators=100, random_state=42)
    clf.fit(X_train, y_train)
    confidence = clf.score(X_test, y_test)
    print("Accuracy:", confidence)
    predictions = clf.predict(X_test)
    mse = mean_squared_error(y_test, predictions)
    print("MSE:", mse)
    return clf

# 5. Prediction & Automation
def predict_future(stock_data, model, forecast_out=30):
    X_forecast = np.array(stock_data.drop(['Prediction'], 1))[-forecast_out:]
    predictions = model.predict(X_forecast)
    return predictions

ticker = "AAPL"
stock_data = get_stock_data(ticker, start="2022-01-01", end="2023-01-01")
X, y = preprocess_data(stock_data)
model = train_model(X, y)
future_prices = predict_future(stock_data, model)

print(future_prices)
Let's Visualize
import yfinance as yf
import numpy as np
import pandas as pd
from sklearn.model_selection import train_test_split
from sklearn.ensemble import RandomForestRegressor
from sklearn.metrics import mean_squared_error
import matplotlib.pyplot as plt

# ... [same functions from the previous script] ...

ticker = "AAPL"
stock_data = get_stock_data(ticker, start="2022-01-01", end="2023-01-01")
X, y = preprocess_data(stock_data)
model = train_model(X, y)
forecast_out = 30
future_prices = predict_future(stock_data, model, forecast_out=forecast_out)

# Plotting the data
plt.figure(figsize=(15, 6))

# Plotting the historical closing prices
stock_data['Close'].plot(label="Historical Prices")

# Plotting the predicted prices
last_date = stock_data.iloc[-1].name
next_dates = pd.date_range(last_date, periods=forecast_out+1).tolist()[1:]
plt.plot(next_dates, future_prices, color='red', label="Predicted Prices", linestyle='dashed')

plt.title(f"{ticker} Stock Price Prediction")
plt.xlabel("Date")
plt.ylabel("Price")
plt.legend()

plt.tight_layout()
plt.grid(True)
plt.show()
This script does the following:
- Fetches the historical stock data and processes it.
- Trains the RandomForest model.
- Predicts stock prices for the next 30 days.
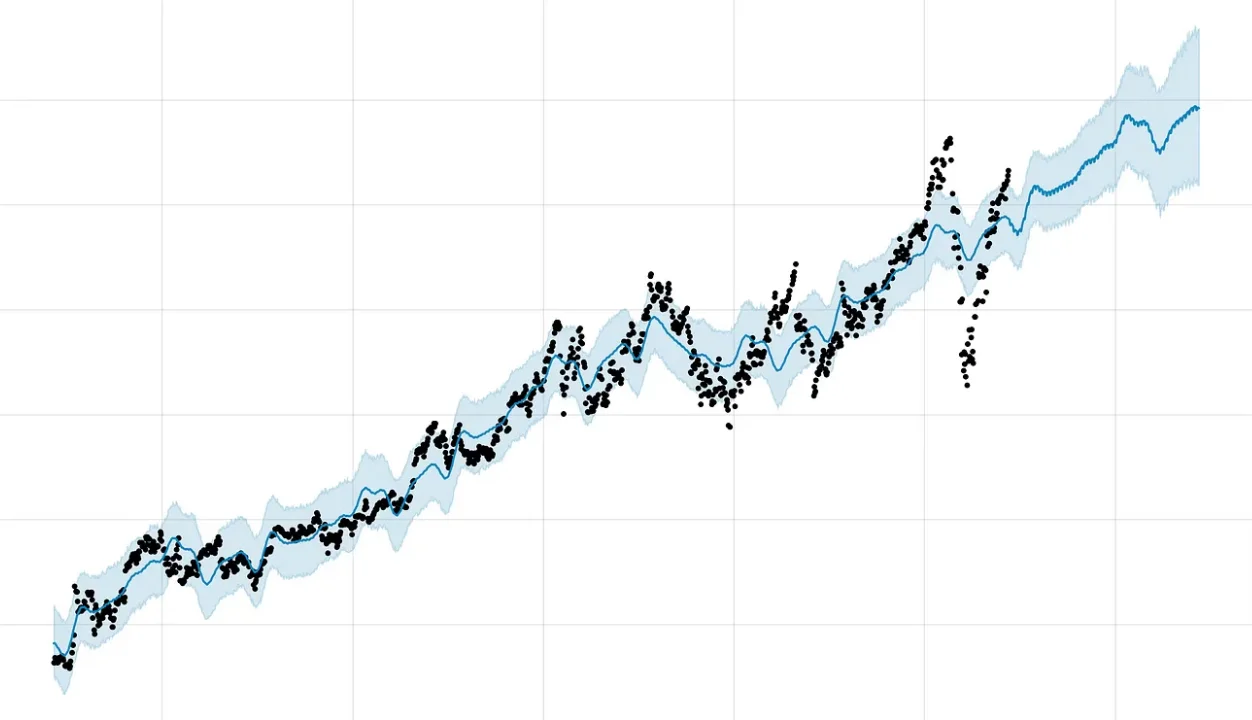
- Plots the historical stock prices in blue.
- Plots the predicted stock prices for the next 30 days in dashed red.
When you run the script, it'll display a graph showing the historical stock prices and the predicted prices. You mentioned the Apple price is 174.49, so the prediction would start roughly from that point and extend into the future based on our model's forecast.
Remember, the predictions might not be accurate given the simplicity of the model and features, but it should give you a visual representation of how such predictions can be graphically displayed.
Basic Steps in Stock Price Prediction
One of the first steps in predicting stock prices is to collect and clean historical data. This process involves gathering a significant amount of data from reliable sources such as Yahoo Finance.
Ensuring the quality of the data is crucial, as any inconsistencies or errors can greatly impact the accuracy of predictions. Once the data is collected, it needs to be preprocessed and cleaned. This includes removing any missing values, outliers, or duplicates.
Feature engineering also plays a vital role in capturing market dynamics by creating relevant features that can potentially influence stock prices. These steps lay the foundation for model selection and training using machine learning algorithms like RandomForestRegressor.
Deep Dive into the Python Implementation
Now let's take a closer look at the Python implementation for deep diving into stock price prediction.
One key aspect is fetching data using the yfinance library, which allows us to easily retrieve historical stock prices.
We can then preprocess the data by calculating important features such as the High_Low_Percentage and Percentage_Change. These features provide valuable insights into market volatility and price movements.
Additionally, we set up prediction targets with a lag of, say, 30 days to capture longer-term trends.
Splitting our data into training and testing sets enables us to train our model on historical data and evaluate its performance on unseen data.
The RandomForest algorithm is often used for this task due to its ability to handle complex relationships in the data.
Limitations and Considerations
It's important to be aware of the limitations and considerations when using machine learning for forecasting future stock prices.
One of the main challenges is overfitting, which occurs when a model becomes too complex and starts fitting noise instead of true patterns in the data. This can lead to poor performance on new, unseen data.
To mitigate this issue, it is crucial to incorporate more features beyond just historical stock prices. Factors such as news sentiment, economic indicators, and company financials can provide valuable information for more accurate predictions.
Additionally, using more sophisticated models like recurrent neural networks or ensemble methods may further improve forecasting accuracy.
However, it's essential to remember that even with advanced techniques, predicting stock prices with complete certainty remains an elusive goal due to the inherent volatility and unpredictability of financial markets.
Advanced Techniques and Further Reading
To deepen your understanding of advanced techniques in forecasting future stock prices, you can explore courses like 'Deep Learning for Time Series Analysis' or books such as 'Applied Predictive Modeling' and 'Time Series Analysis and Its Applications'.
These resources delve deeper into the complexities of stock price prediction using machine learning. Advanced models like LSTM and ARIMA are discussed in detail, providing insights into their strengths and limitations.
Additionally, incorporating other data sources such as news sentiment and economic indicators is emphasized to enhance the accuracy of predictions.
Conclusion
In conclusion, this beginner's guide has provided an analytical and data-driven approach to stock price prediction using machine learning.
We explored the challenges involved in this task and discussed the basic steps required for implementation.
The Python code snippets demonstrated how one can get started with building predictive models. However, it's crucial to acknowledge the limitations and considerations associated with stock price prediction.
For those seeking more advanced techniques and further reading, there are numerous resources available in this field of study.
You might also like
View all


Comments (0)
No comments yet. Be the first to comment!